The whole class, in one place.
Everything you record during class adds up. ClassApt's reports show the patterns across a class, and the status of every student side by side, instead of one student at a time.
The student detail page shows a single student's observations, contacts and help requests. When I evaluate a whole period, opening each student in turn takes too long. The reports put that same information for every student on one screen.
One Set of Filters
The reports share the same filters: one period or all of them, a date range or a single week, and a group. A group lets you read the class without the students who would skew it, such as independent study students who are observed less often.
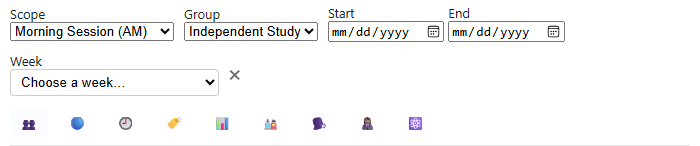
Who You Have Talked With
Contacts are the conversations you record with each student. The line shows how many you had each day. The figures above it give the total, the mean per student and the median per student.
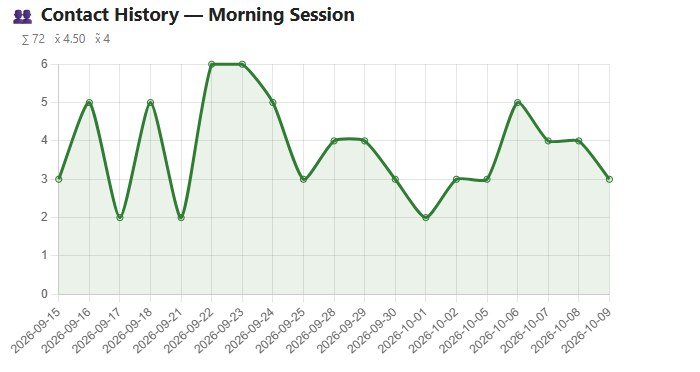
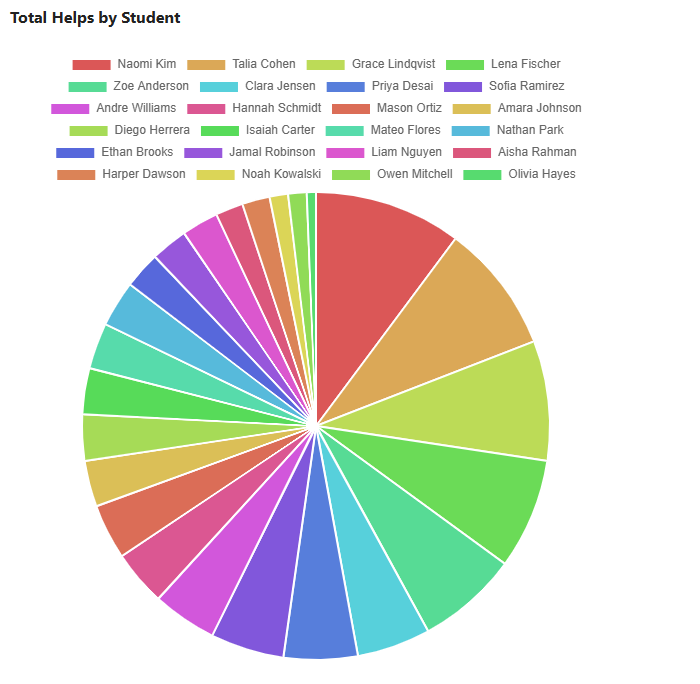
Share by Student
The pie shows how those conversations divide among students. A small slice, or a name missing from the legend, is a student you may be overlooking.
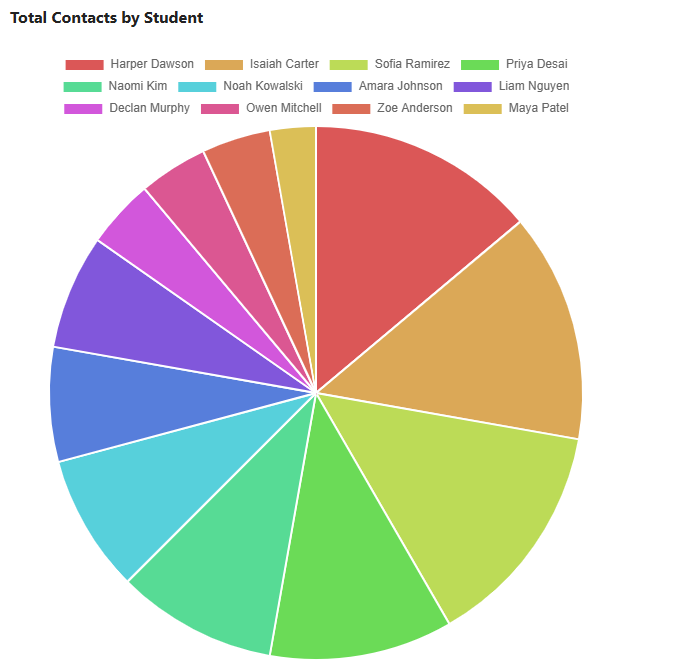
Where Help Is Going
Help requests are counted by day for each period. A spike usually marks a hard assignment or a set of directions that needs another pass.
Who Asks
Some students ask for help often, and some never do. Both are worth knowing. A student who never asks may be fine, or may be the one who most needs you to stop by.
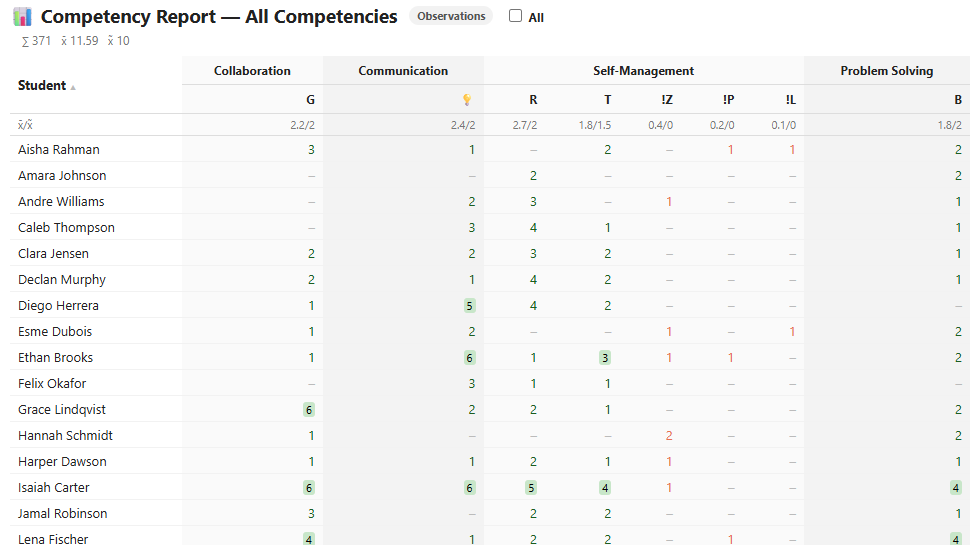
Every Student, Every Skill
The competency report puts every student and every skill you track in one table. Each cell is how many times you recorded that skill for that student. A shaded count means the student has enough evidence.
The row under the headings gives the mean and median for each skill. When the mean is well above the median, a few students are carrying the count, and the rest of the class may not be showing that skill yet.
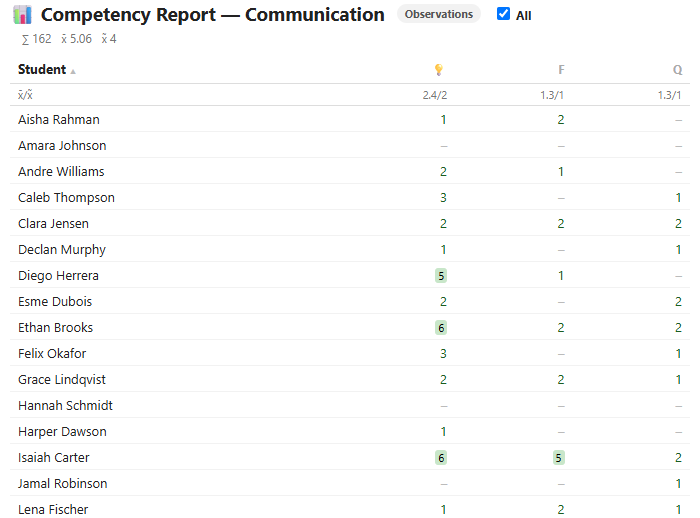
Evidence From Skills You Have Retired
I rotate which skills I track as the year goes on. Checking All adds the skills you have turned off, with the evidence you recorded while they were in use. Their headings are gray, so it is clear which ones are current.
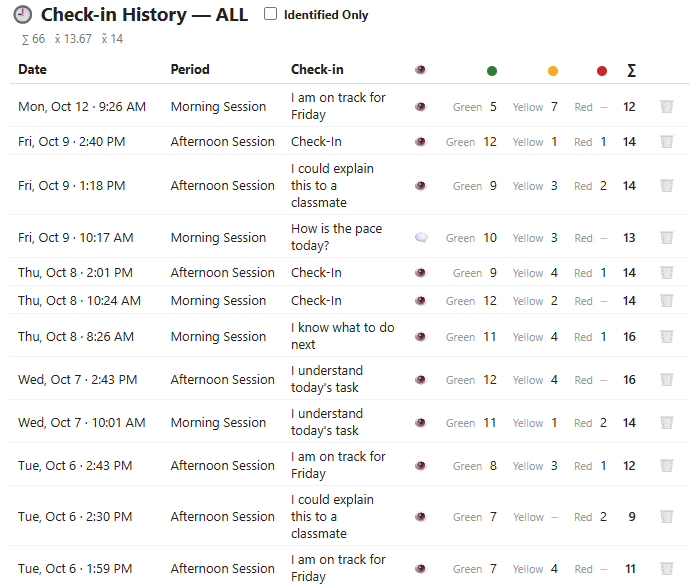
Every Check-In, Kept
Each check-in is listed with its question, the period and how many students chose each answer. For an identified check-in, you can open the names behind each count. Anonymous check-ins keep only the counts.
Fields You Define
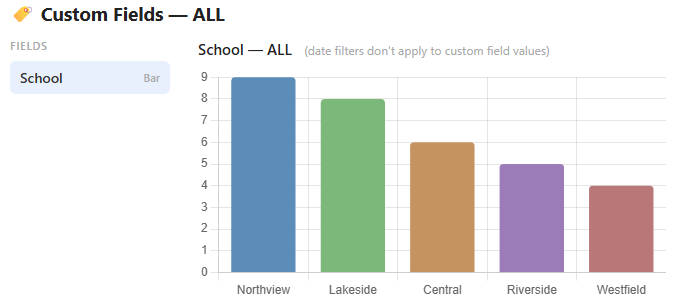
You can add your own fields to each student, such as the school they come from, and chart them across the class. Each student counts once, even when they are in two of your periods.
Where the Numbers Come From
Every figure here comes from something recorded during class: a check-in, a tap on a student's name, a request for help. Read how that evidence is recorded.